|
Method 1: (for TI-84 Plus CE)
This method deals with the options to the left of "Y1=".
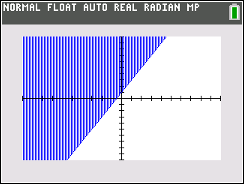
Example 1: Graph y > 2x + 1
•
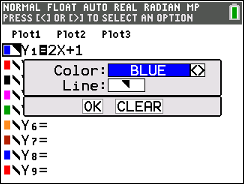
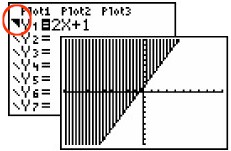
From the graph entry screen, arrow left until a box is formed around the color and the line choice to the left of Y1.
• Hit ENTER.
• A box will appear on the screen where you can change the color and style of the line for the graph. If you scroll through the choices for line, you will find two right triangle options.
The right triangle with the right angle in the upper right corner represents the inequality "greater than". The triangle with the right angle in the lower left corner represents "less than".
The draw back to this method is that the calculator will not distinguish between a solid line (for <) and a dotted line (for <) on the graph. All lines are solid. You will need to know, on your own, when to use solid versus dotted lines if copying this solution. |
Arrow to the left. Hit ENTER
|

|
Method 2: (for TI-84 Plus CE)
This method deals with the Application called "Inequalities".
Note that this example will be using "less than",
Example 2: Graph y < 2x + 1
Engage the Application: "Inequaz:
• Hit APPS key.
• Arrow down to #6 Inequalz (or it may be a different number).
• Hit ENTER. Then PRESS ANY KEY.
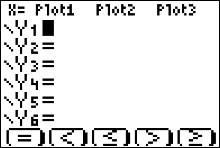
You will now be on the graph entry screen.
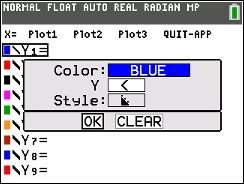
• Arrow to the left of "Y1 =", but this time you will get a box formed around the color, line, and Y1 =.
Press ENTER.
• A box will appear. The choices in the box have now changed. Also, the top of the screen now offers "x =" and
"QUIT-APP" choices.
• Scroll through the options next to "Y" in the box. You will now see the actual symbols for < , < , > and > . The corresponding right triangles will appear below in the "Style" section. Note the dots on the hypotenuse of the triangles for < and >. The calculator will now be dealing with dotted lines versus solid lines in the graphs.
|
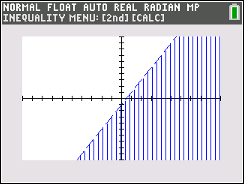
y < 2x - l
Note the dotted line indicating
"less than but NOT equal to".
|
• Choose the "less than" symbol for this example. OK. ENTER. You will see "Y1 < " on the screen.
•
Enter 2x - 1.
Note: The calculator recognized that the choice of "<" needs to have a dotted line for this linear graph. A dotted line appears on the graph screen.
• Go to "Quit-App" at the top of the graph entry screen to turn the Inequality application off, when you are finished with this problem. |
|
Method 1: (for the Ti-84 Plus)
Use the "shading" options to the left of "Y1 =".
The option choice for Example 1 will look like a right triangle shaded above the regular-appearing slanted line.
The draw back to this method is that the calculator will not distinguish between a solid line (for >) and a dotted line (for >) on the graph. All calculator lines are solid. You will need to know when to use solid versus dotted lines.
|
Example 1: Graph y > 2x + 1
- Enter 2x + 1 into Y1
- Arrow to the far left side
of Y1
- Hit ENTER until the
"shade above"
symbol
is displayed.
- Hit ZOOM #6 ZStandard (for a 10x10 window)
- Graph
- NOTE: You will have to
determine whether to draw a
solid line or a dotted line for y = 2x + 1.
This problem will need a solid line because of the "less than or
equal to" sign. The calculator
will display a solid line at all times.
(The Application program called
"Inequalities" will display solid and dotted
lines on the graphs.)
|
 |
|
Method 2: (for TI-84 Plus)
This method deals with the Application called "Inequalz".
Note that this example will be using "less than",
Example 2: Graph y < 2x + 1
Engage the Application: "Inequalz:
• Hit APPS key.
• Arrow down to Inequalz.
• Hit ENTER. Then PRESS ANY KEY.
You will now be on the graph entry screen.
• Move cursor over "=" symbol.
• Press ALPHA and choose one of the five top row keys F1 to F5 to choose the inequality you want.
You now have "Y < " on the screen for this example.
Notice the triangle (with dots) to the far left.
• Arrow to the right off the symbol and enter 2x + 1.
• Press GRAPH.
Notice that a dotted (dashed) line is used for this strictly less than problem.
• Quit the App!!!!. The symbols at the bottom of the "Y=" screen will remain until you close the App.
Hit APPS, ALPHA, x2 keys and an "Application" screen will appear with Inequalz listed at the top.
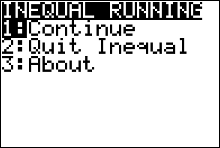
Hit ENTER and get the screen "INEQUAL RUNNING".
Choose 2: Quit Inequal.
|
To QUIT: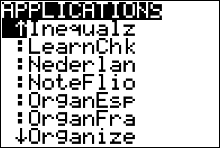
|
Let's look at a few more examples:
TI-84 Plus CE will use the Inequality APP
TI-84 Plus will use the "shaded triangle" option.
|
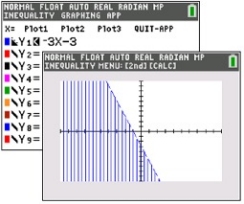
Example 3: Graph y < -3x - 3
- Choose APPS key #7 Inequalities. Arrow left to engage box.
- Choose "<" option from box.
- Arrow right to move off the < symbol.
- Type in -3x - 3
- GRAPH
- See graph with dotted (dashed) line shown.
- Remember to QUIT the APP.
|
|
| |
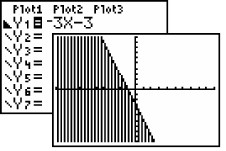
Example 3: Graph y < -3x - 3
- Notice the "shade below" symbol to the
far left of
the Y1.
- Again, you must determine whether to draw a solid
or dotted line as the calculator (using this method) does not show dotted (or dashed) lines. This problem needs a dotted line because it is
strictly "less than" (no "equal to").
|
 |
|
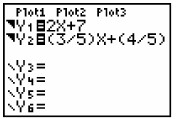
Example 4: Solve
the system: 
- You will need to isolate the y variable in
the second equation so that it can be
entered into the calculator.
Solving algebraically,
(be careful of the direction of the inequality symbol in this
problem.)
|
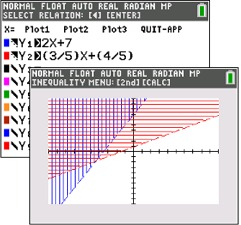 After entering the first inequality in the APP, arrow down, arrow left for box, ENTER, and begin the process again for the second inequality. When both are entered, hit GRAPH. After entering the first inequality in the APP, arrow down, arrow left for box, ENTER, and begin the process again for the second inequality. When both are entered, hit GRAPH.
|
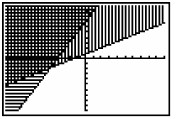
Example 4: Solve
the system:
- Follow the same directions as stated in the example above.
|
|
|
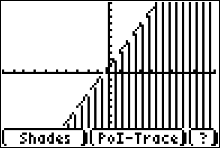
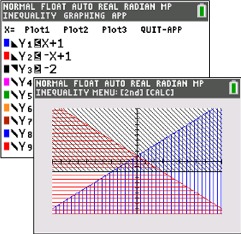
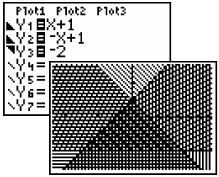
Example 5:
Solve

- Using the APP, enter all three inequalities with appropriate symbols.
- Answer is the darkest shading, overlapping all three, which is the small triangle near the center.
|
|
Example 5:
Solve
y < x + 1 and y < -x + 1 and y > -2
- Enter all three inequalities with appropriate "shade
above" or "shade below" symbols.
- Answer is the darkest shading forming a triangle near the center.
|
Zoom Decimal
view. |