Solving Linear - Quadratic Systems
A quadratic equation is defined as
an equation in which one or more of the terms
is squared but
raised to no higher power.
Linear - quadratic system: Line & Parabola
(where only one
variable is squared) |
| Solve graphically: |
y = -x2 + 2x + 4 (quadratic -
parabola)
x + y = 4 (linear) |
|
1. |
Change the linear equation
to "y=" form. |
y = -x + 4 |
|
2. |
Enter
the equations as "y1=" and
"y2=".
(Be
sure to use the negative key, not the subtraction key, for
entering negative values.) |
|
|
3. |
Hit GRAPH
to see if and where the graphs intersect.
(Using ZOOM
#6: ZStandard creates a 10 x 10
viewing window.
You may need to adjust the WINDOW to see a clear picture of the intersection locations for the
two graphs.) |
|
|
4. |
Under CALC (2nd
Trace) choose #5 intersect to find the points where the graphs intersect. |
|
|
5. |
When prompted for the "First curve?", move the spider on,
or near, a point of intersection. Hit Enter. |
|
|
6. |
When prompted for the "Second curve?", just hit Enter.
|
|
|
7. |
Ignore the prompt for "Guess?", and hit Enter.
|
|
|
8. |
Read the answers as to the
coordinates of the point of intersection. These
coordinates appear at the bottom of the screen. Point of intersection
(left side):
(0,4) |
|
|
9. |
If your graphs have a
second point of intersection, repeat this process to find the
second point. Choose the #5
intersect choice and repeat the steps for finding the
intersection. Point of intersection (right side):
(3,1) |
|
Linear - quadratic system: Line & Circle
(where both
variables are squared) |
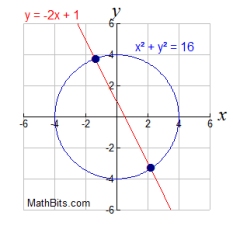
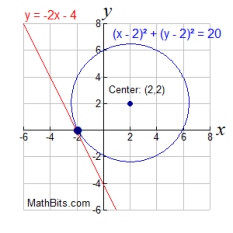
In a linear- quadratic system where BOTH variables in the quadratic are squared, the graphs will be a cirlce and a straight line. When graphing a circle and a straight
line on the same set of axes, three situations are
possible.
 |
 |
 |
| The equations will intersect in two locations.
Two real solutions. |
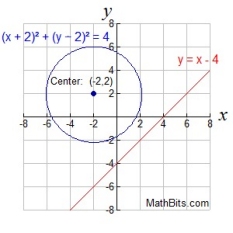
The equations will intersect in one location (a tangent). One real solution. |
The equations will not intersect.
No real solutions. |
| Solve graphically: |
x2 +
y2 = 25 (quadratic - circle)
x - y = 5 (linear) |
|
1. |
Change the linear equation
to "y=" form. |
y = x - 5 |
|
2. |
Change the quadratic
equation to "y=" form.
 |
can be entered as two separate entries:
or a "list" notation may be used:
 |
|
|
Enter the equations.
The circle entry shown here uses the "list" notation.
|
|
3. |
| If you hit GRAPH
at this point using a standard window (ZOOM
#6: ZStandard) your circle will
not resemble a circle due to the 3 to 2 aspect ratio of
this screen. |
|
Choose ZOOM #5: ZSquare to get a true
looking circle.
|
Notice the missing pixels near the x-axis.
|
|
4. |
Under CALC (2nd
Trace) choose #5 intersect to find the points where the graphs intersect. |
|
|
5. |
We will find the left
point of intersection first.
When prompted for the "First curve?", use the down arrow key to move to the
bottom portion of the circle. Hit Enter. |
|
|
6. |
When prompted for the "Second curve?", just hit Enter.
|
|
|
7. |
Ignore the prompt for "Guess?", and hit Enter.
|
|
|
8. |
Read the answers as to the
coordinates of the point of intersection. These
coordinates appear at the bottom of the screen. Point of intersection
(left side): (0,-5) |
|
|
9. |
We will find the right
point of intersection next. This point is occurring
where the missing pixels are located. We need to zoom in at this location to
place more pixels on the screen.
After zooming, go to CALC (2nd
Trace), choose #5 intersect, and find the points where the graphs intersect. |
 |
|
10. |
 30b
30b
Notice the graph is set to Y1.
Use up and down arrows to get Y2. |
No need to guess. Hit ENTER. |
|
11. |
Point of intersection (right
side): (5,0)
Solution: (0,-5) and (5,0) |
 |
|
When working with a circle, always check the
equation statement in the upper left corner to see where you
are. The up and down arrows will move you between the
equations. |
|