Cumulative Frequency Histogram
Cumulative Frequency Histogram
From a Frequency Table:
| X | 0 | 1 | 2 | 3 | 4 | 5 | 6 | 7 | 8 | 9 | 10 |
| f | 3 | 4 | 7 | 4 | 10 | 9 | 7 | 3 | 6 | 2 | 4 |
prepare a cumulative frequency histogram representing this data.
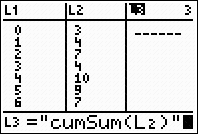
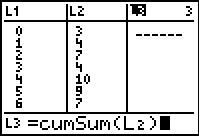
| 1. Enter the data
values in L1. Enter their frequencies
in L2, being careful that each data value and
its frequency are entered on the same horizontal line. (See
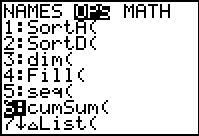
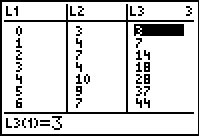
Basic Commands for entering data.) 2. Have the calculator prepare a cumulative sum of the values in L2 and place the answers in L3. Move your cursor to L3 and arrow up onto L3. Now, go to LIST (2nd STAT), arrow to the right to OPS and choose #6 cumSum(. Indicate that L2 is the list that will create the cumulative sum. Press ENTER. The cumulative sum now appears in L3. |
|||
|
|||
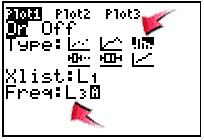
3. Activate the histogram. Press 2nd STATPLOT and choose #1 PLOT 1. You will see the screen at the right. Be sure the plot is ON, the histogram icon is highlighted, and that the list you will be using is indicated next to Xlist. When preparing a Cumulative Frequency Histogram set Freq: L3 so that the cumulative sum values for the data values will be determined by the numbers from L3. |
|
||
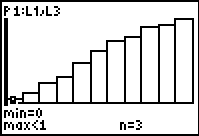
| 4. To see the histogram, press ZOOM and #9 ZoomStat. Press the TRACE key to see on-screen data about the histogram. |
|
||
![]()
Finding Your Way Around
TABLE of CONTENTS