|
Measures of Dispersion
Range, Standard Deviation, Variance, Mean
Absolute Deviation
Problem: For
the data set {10, 12, 40, 35, 14, 24, 13, 21, 42, 30}, find the
range, the standard deviation, the variance, and the mean absolute deviation
to the nearest hundredth.
A quick reminder before we begin
the solution:
In statistics, the
population form is used
when the data being analyzed includes the entire set of
possible data.
The sample form is used
when the data is a random sample taken from the entire set of data.
Check the "Standard Deviation" and "Variance" sections below for more information on how the calculator presents population versus sample forms. |
|
To find
the range: |
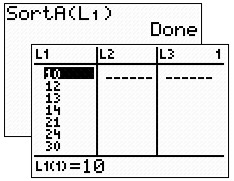
To find the range:
Enter the data, as is, into L1. You can enter the list on
the home screen and "store" to L1, or you can go directly to L1 (2nd STAT, #1 Edit).
|
|
| Sort the list to quickly
retrieve the highest and lowest values for the range.
(2nd STAT, #2 SortA).
You can choose ascending or descending. Read the high and low values from
L1 for computing the range.
Range = 42 - 10
= 32. |
 |
OR:
To
find the range: Do
not sort. Simply type on the home screen using the
min and max functions found under MATH → NUM #6 min and
#7 max.
|
Range = 32
|
| To
find standard deviation: |
|
To
find standard deviation: Since this
question deals with the complete set, we will be using "population"
form, not sample form.
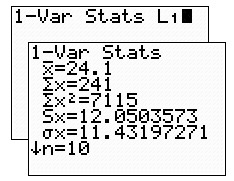
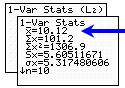
Go to one-variable stats
for "population"
standard deviation. STAT → CALC #1 1-Var Stats
 NOTE! The standard
deviations found in the CATALOG,
stdDev, and also found by 2nd LIST
→ MATH #7 stdDev
are both Sample standard deviations.
NOTE! The standard
deviations found in the CATALOG,
stdDev, and also found by 2nd LIST
→ MATH #7 stdDev
are both Sample standard deviations.
|
|
 |
= mean |
 |
= sum of the data |
 |
= sum of squares of the data |
|

|
= sample standard deviation |
|
 |
= population standard deviation |
|
n |
= sample size (# of pieces of data) |
|
 |
= smallest data entry |
|
 |
= first quartile |
|
 |
= median (second quartile) |
|
 |
= third quartile |
|
 |
= largest data entry |
Population
Standard Deviation = 11.43 |
|
FYI: Using the
lists, the calculator can simulate a spreadsheet style
"by hand" computation of standard deviation. Click
here to see the spreadsheet-style approach.
|
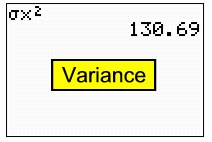
| To find variance: |
| To find variance: The "population"
variance is the square of the population standard
deviation.
The  symbol is under
VARS - #5 Statistics symbol is under
VARS - #5 Statistics
NOTE! The
variance found in the
CATALOG and also found by
2nd List
→
MATH #8 variance are both Sample variances. |
 |
| To find mean
absolute deviation: |
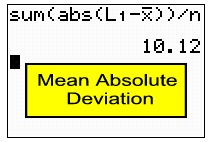
To find mean
absolute deviation:
To calculate the
mean absolute deviation you will have to enter
the formula.
NOTE! Be sure that
you have run 1-Var Stats
(under STAT - CALC #1)
first, so that the calculator will have computed  .
Otherwise, you will get an error from this formula. .
Otherwise, you will get an error from this formula. |
 and n are found under VARS #5 Statistics. Sum and
abs are quickly found in
CATALOG. Sum is also
under 2nd LIST - MATH #5 sum.
abs is also under MATH -
NUM #1abs. and n are found under VARS #5 Statistics. Sum and
abs are quickly found in
CATALOG. Sum is also
under 2nd LIST - MATH #5 sum.
abs is also under MATH -
NUM #1abs. |
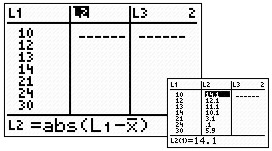
OR: To
find mean absolute deviation:
A longer, but workable, solution can also
be accomplished using the lists. As stated above,
run 1-Var Stats so the
calculator will compute .
Now, go to L2 (STAT #1 EDIT) and move UP onto L2.
Type, at the bottom of the window, the portion of the
formula that finds the difference between each data
entry and the mean, using absolute value to make these
distances positive. Now, find the mean, ,
of L2 by using 1-Var Stats
on L2,
and read the answer of 10.12. |
 |
|