|

Composition with
Inverse Trig Functions
The graphs of the compositions of a
trigonometric function with its inverse can yield some interesting
results. It is understood that a function and its inverse, when
composed, return the original starting value -- they UNDO one another.
So, why does this "appear" to NOT be true when working with
trigonometric functions on the graphing calculator?
Let's do some investigating:
|
The calculator is set to Radian mode.
|
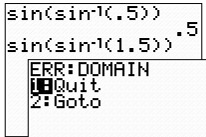
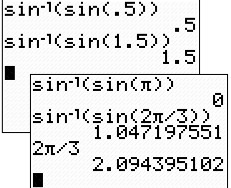
The composition of a value within the limited domain of the
sine inverse function,
[-1,1], returns the starting value, just as expected.
If we, however, choose a value outside the domain of the
sine inverse function, an error message is returned.
|
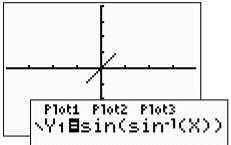
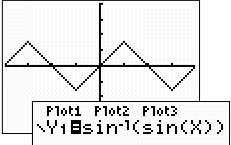
The graph of the composition returns the identity line, y =
x, for the domain of the sine inverse function from -1 to 1.
Our expected result of returning the starting value holds
true as long as we remain within the domain of the sine
inverse function.
|
Conclusion 1: The calculator is
seeing "sine inverse" to be ONLY the principal
sine inverse function, and as such limits its domain to
[-1,1]. All other domain values are seen as producing an error.
Consequently,  ,
which starts with sin-1(x), is limited to accepting
only values within the domain of the "function" sin-1(x), which
is [-1,1]. We see only these x-values being plotted which
creates only a "segment" of the expected identity line y = x. ,
which starts with sin-1(x), is limited to accepting
only values within the domain of the "function" sin-1(x), which
is [-1,1]. We see only these x-values being plotted which
creates only a "segment" of the expected identity line y = x.
Let's REVERSE the order of the composition and see what happens:
Conclusion 2: When the "starting"
function in the composition is sine ( ),
all numerical evaluations of the composition are possible, but the
results will be restricted to the range of the inverse function. ),
all numerical evaluations of the composition are possible, but the
results will be restricted to the range of the inverse function.
When sin(x) produces
positive values, the inverse function maps those values to  in the first
quadrant (or on the y-axis). When sin(x) produces
negative values, the inverse function maps those values to in the first
quadrant (or on the y-axis). When sin(x) produces
negative values, the inverse function maps those values to  in the fourth
quadrant (or on the y-axis). in the fourth
quadrant (or on the y-axis).
|
When sin(x) = 0, sin-1(x)
= 0.
Consequently, the graph
takes on the appearance of straight line segments alternating
between positive and negative slopes, due to the restricted
range of sine inverse to
 . . |
 |
|